
Version 3.0 - Legacy
Last: Vers. 5.9 - 2022
- Developers' Guide
- Introduction
- Administrator's Guide
- Connecting to Everyware Cloud
- REST APIs
- Supplementary Documentation


PART 3. CONNECTING
DEVICES TO THE EVERYWARE™ CLOUD
Google Chart Tools Support
· Overview
Google Chart Tools Support
Overview
Google Chart Tools is a JavaScript framework to plot data into rich and interactive charts displayed on a web page. The Everyware Device Cloud (EDC) platform comes with native support for the Google Chart Tools Datasource Protocol. As such, you can securely use your Everyware Cloud account as a data source for Google Charts and build rich and powerful dashboards with only simple JavaScript and HTML. In this example, you will create a sample dashboard to visualize the data published by the example in Connecting to the Cloud in Java.
Prerequisites
Complete the following steps before starting this example:
- Complete the
edc-java-clientexample detailed in Connecting to the Cloud in Java to publish data to your Everyware Cloud account. - Familiarize yourself with the Google Chart Tools by browsing the chart gallery or experimenting with the playground.
Opening the Dashboard
You should have already downloaded the edc-google-charts-dashboard example available on the GitHub repository at https://github.com/eurotech/edc-examples/.
In your workspace under edc-google-charts-dashboard/src/main/webapp, open
the file dashboard.html in
your favorite text editor. This file follows the data model used in the edc-java-client example and assumes that
your data is published under the sample/data
topic and contains metrics named int, dbl,
flt.
Change the following lines of code to use your Everyware Cloud account Username and Password and save your changes.
|
// Issue the first login call into the platform
|
Using the Firefox or Safari browser, open dashboard.html. (Note: this will not
work in Internet Explorer.) The following screen capture shows an example
dashboard. The Javascript code is set by default to refresh every 60 seconds
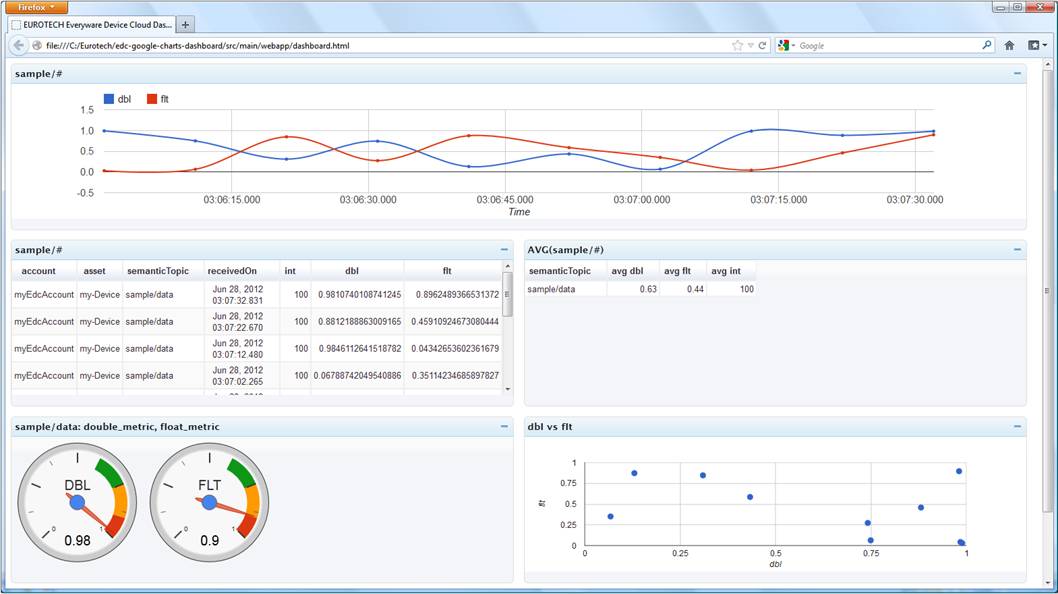
|
|
Note: If you use the Chrome browser to open dashboard.html as a file, you must disable the same-origin policy in Chrome using the --disable-web-security argument. For additional information, refer to the link http://stackoverflow.com/questions/3102819/chrome-disable-same-origin-policy. |
Plotting the Charts
In this section, we will walk through the JavaScript code required to plot the charts in the dashboard.
We will start from the JQuery AJAX call that logs into the EDC platform. It performs HTTP Basic Authentication on the HTTPS-protected URL of the EDC Datasource for Google Chart Tools. Upon successful authentication, a session is established, and all the follow-up requests from the Google Chart Tools library will be trusted. This is a mandatory step before you can proceed further, and you always need to start your dashboard code with the following login call.
|
|
A corresponding dsUrl+"/logout"
AJAX call is available to close the server-side session and invalidate the
associated cookie. This example does not include a logout call, but it is
certainly advised to address this aspect before deploying this dashboard in
production.
Next, we will look at the implementation of the done() callback function that is
responsible for the plotting of the charts. The file dashboard.html includes code for a
table, line chart, gauge, table of averages, and scatter chart. We
will look at the following code for a line chart in detail.
|
|
The line chart example uses the google.visualization.ChartWrapper class to plot the graph.
In the first field, chartType
is defined for a LineChart.
The second field is the URL of the EDC Datasource that will be used by the Google Chart Library to fetch the data to be displayed. The EDC Datasource based URL is https://api-sandbox.everyware-cloud.com/gvds. It takes the following query parameters:
·
topic: Mandatory
parameter with the topic for which messages are requested. The value of the
topic parameter should be URL encoded.
·
limit: Maximum
number of entries to be returned.
·
offset: Starting
offset for the entries to be returned.
·
startDate: Start
date of the date range requested. The parameter is expressed as a long, counting the number of milliseconds
since January 1, 1970, 00:00:00 GMT.
The default value of 0 means no start date.
·
endDate: End
date of the date range requested. The parameter is expressed as a long, counting the number of milliseconds
since January 1, 1970, 00:00:00 GMT.
The default value of 0 means no end date.
The data returned by the dataSourceUrl will contain the following fields for each EdcMessage published under the specified
topic and in the specified date range:
· account: account used to publish the MQTT message
· asset: identifier of the asset publishing the MQTT message
· receivedOn: timestamp added by the server upon MQTT message reception
· sentOn: timestamp added by the client upon MQTT message transmission
· semanticTopic: the semantic part of the topic to which the messages were published (e.g. sample/data)
· position: holds location-related properties and has the following sub-fields: latitude, longitude, altitude, precision, heading, speed, timestamp, satellites, status
·
metrics: for
each metric contained in EdcMessage,
a field will be available (e.g. int,
dlb, flt in the case of the edc-java-client)
The data returned by the EDC Datasource is then further
processed using the query expressed
in the next parameter. The query is expressed using the Google Chart Tools Query
Language that is a SQL-like language allowing basic filtering and grouping
of the data returned by the data source. Each of the aforementioned fields
returned by the EDC Datasource can be referenced in the query. It is important
that the data returned by the query is formatted according to the data format
requirements of the chart type that you are about to draw. For example, the data
format for a LineChart requires the first column to contain X-axis values
(e.g. receivedOn in this example)
and the following columns to contain the Y-axis values for each data series to
be plotted (e.g. dbl, flt in this example). The data format
slightly varies for each chart type, so please refer to the chart documentation
to craft the appropriate query on the data source.
Continuing through the code, the refreshInterval determines how
frequently in seconds to requery the datasource for updated data.
The options
object parameter is specific to each chart type and controls the visualization
of the chart.
Finally, the containerId
parameter specifies the id
of the div element that will
contain the generated graph.
Next Steps
There is certainly more elaborate processing of the data that can be performed and that is not illustrated in this example. We encourage you to explore the Google Chart Tools documentation for Data Views and the Data Manipulation Methods.
Moreover, Google Charts can be published as Gadgets into the iGoogle portal pages. You can find a tutorial for that process at https://developers.google.com/chart/interactive/docs/dev/gadgets.
Finally, you are encouraged to package this example into a proper WEB application before deploying it into production. Better handing of the login and logout aspects is appropriate. A suggestion can be to convert this example into a JSP-page and package it as a J2EE war file that can be deployed into an application container like Tomcat. This example is kept simple on purpose, as it focuses on the plotting of charts using the EDC platform as a Datasource.