Version 3.0 - Legacy
Last: Vers. 5.9 - 2022
- Developers' Guide
- Introduction
- Administrator's Guide
- Connecting to Everyware Cloud
- REST APIs
- Supplementary Documentation


PART 2. ADMINISTRATORS
GUIDE
Viewing Device Data
Viewing Data by Asset and Topic
Viewing Data by Asset and Topic
The Data by Topic and Data by Asset panels allow you to query data from the Everyware Cloud Console. You will need data:view permissions to perform this operation.
As data is published to the Everyware Cloud, the platform automatically creates data registries to track the following information:
ñ The asset from which the data originated
ñ The topic to which the data was addressed
ñ The metric names that are contained into each message and, therefore, the names of the metric which received any values for a given asset or a given topic
It is important to emphasize that topics are hierarchical. Data published to a topic state/city is implicitly addressed to city and state. The Everyware Cloud performs topic-level aggregations automatically for topics up to 5-levels deep.
Through its data registries, the Everyware Cloud allows for simplified data browsing and data discovery. For the complete set of all possible query operations offered by the Everyware Cloud platform, please refer to the section Using REST APIs and the reference REST API documentation available at https://api-sandbox.everyware-cloud.com/docs/index.html.
The data queries in the Everyware Cloud console operate on the data published using EC metrics (excluding the optional message Body). For more information and examples about assets, topics, data, and metrics, please refer to the sections MQTT Introduction and Everyware Cloud Protocol.
Using the platform data registries, the Everyware Cloud Console allows browsing and querying of your device data in the following ways:
ñ Data by Asset is appropriate when you query your device data following the physical view, knowing the device and asset that originally produced the data.
ñ Data by Topic is appropriate when you are not interested in the device that published the data but rather the topic to which that data was addressed. Typically, this is the case when you defined a topic namespace for your application and you leveraged the Everyware Cloud platform to aggregate your data at each topic level.
Data by Asset
The Data by Asset panel queries the data by asset. By default, an asset represents the device gateway (and its MQTT connection) from which the data was originated. To view the data, select an asset in the Available Assets list, click the checkboxes in the Available Metrics list for the metrics you want to display, and then click the Query button.
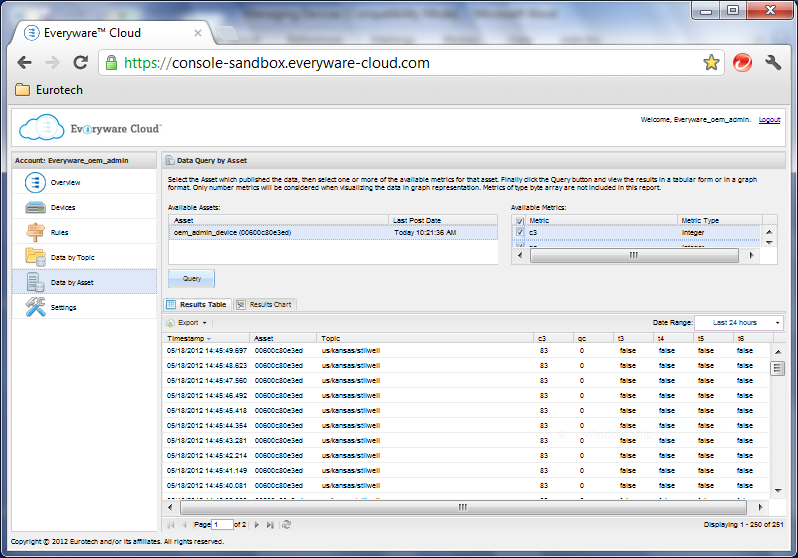
The Console will fill the table with collected data as shown in the following screen capture. Use the vertical scroll bar to view data within a page and the page navigation icons at the bottom of the screen to move between pages. The Export button saves data to Excel or CSV formats.
You may also display the query results graphically using the Results Chart tab as shown in the following screen capture.
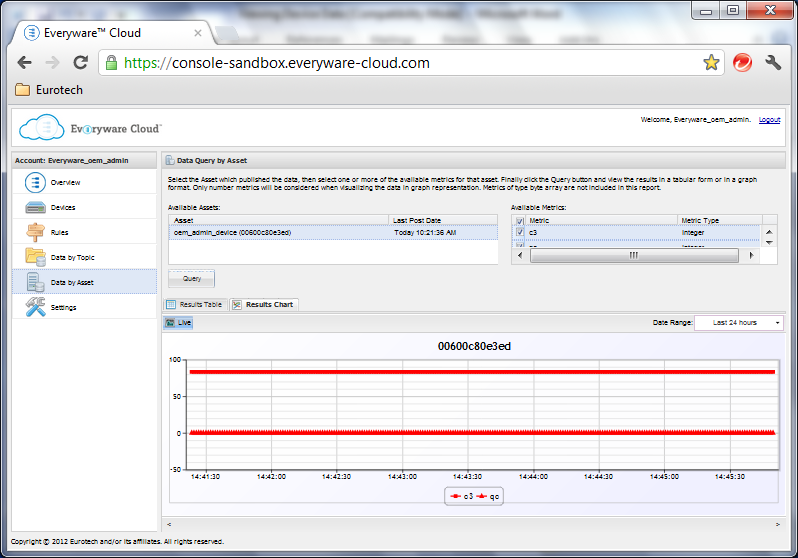
The Console provides a variety of controls to select the range of data to display in the Results Chart:
ñ Use the Date Range drop-down to select the time period to examine.
Up to 125 data points are displayed at a time.
ñ Use the scroll bar to navigate through additional data in the selected time period.
ñ Drag your mouse over a range of data to zoom in.
ñ Use the Reset Zoom link that appears to restore the default zoom level.
ñ Click the Live button to display data in real time.
The Everyware Cloud pushes data to the Console as it is received from devices.
The length of time that your data is accessible is defined by your Everyware Cloud account plan. Data in the Sandbox Console is only stored for 7 days, regardless of the plan.
Data by Topic
The Data by Topic panel demonstrates the powerful flexibility of Everyware Clouds schema-less data storage. You are only limited by the schema that devices use when publishing.
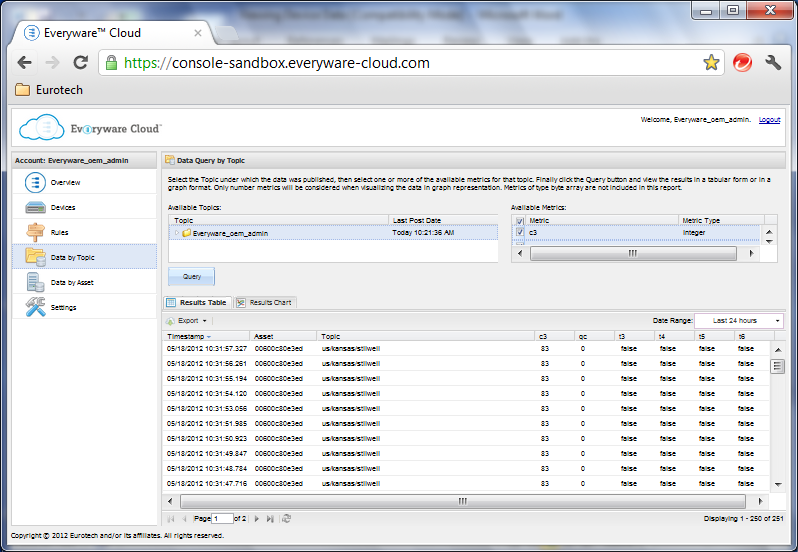
To display collected data, select the topic or topic branch from the Available Topics list, select the data metrics to display from the Available Metrics list, and then click Query. The Console will fill the table with collected data as shown in the following screen capture. Operation of the display is otherwise the same as for Data by Asset.
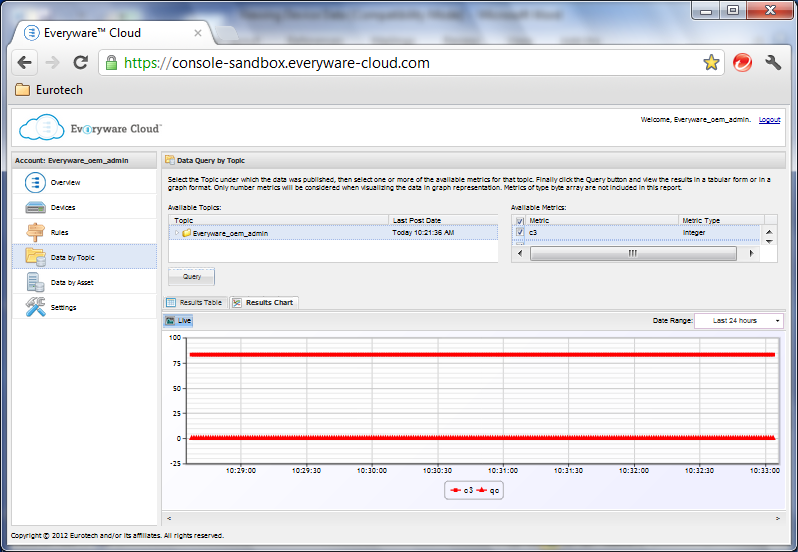
Control of the Results Chart, as shown in the following screen capture, is the same as for Data by Asset.